The author of this section did not manage to update the following text. Refer to grape.h for the correct structures and types.
All display methods use various colors to visualize the data according to the evaluated function with isolines (grid mode) or colored patches (patch mode). Since the colors are not to be chosen arbitrarily, a scale is used showing the relation of colors and values. The hsv color model is used in GRAPE to determine the color in the display methods on an fe2d or an fe3d structure.
This color model is organized as follows:
Let C be the set of all available colors except black. Then the user gets a unique mapping between the data to visualize and the color, if the data values are between 0 and 1.Therefore it is necessary to map the range of data onto the interval [0,1]. This will be done with help of the colorbar structure if the minimum is stored in colorbar-->min and the maximum in colorbar-->max.
Those values which the lines are drawn for (on colorbar and for the isoline-methods), are calculated by the formula
![]()
The display methods using the colorbar do not determine the minimum and maximum value, the values must be provided by the user. If various display methods use different colorbars, then the colorbars are organized in a list. In this list the colorbar for each display method will be identified by the pointer of the calling method.
If particular values are of interest, they can be put onto the colorbar additionally. A name which can comprehend 100 characters at most belongs to each colorbar. However, only the first seven characters appear on a button or a ruler belonging to this colorbar. A colorbar can not be rotated.
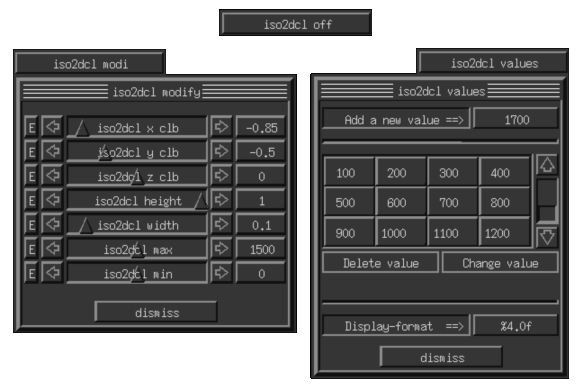
If a colorbar is called by a GRAPE-display-method, three buttons appear automatically: a button to switch the colorbar on or off, a button to modify the colorbar and a button to change the particular values.
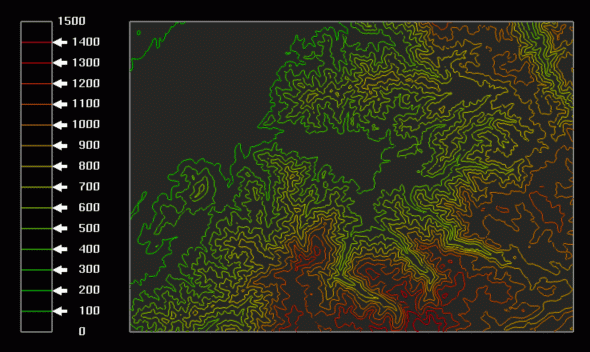
The contour of the altitude of the Breisgau-Hochschwarzwald is shown in the following as an example of a colorbar (the display-method is "isoline-select" with ln(line-distance) = 10):

The correspondent buttons and layers are:

Copyright © by the Sonderforschungsbereich 256 at the Institut für Angewandte Mathematik, Universität Bonn.